List of your charts
To see the list of your charts, navigate to the Analytics → Explorer page.
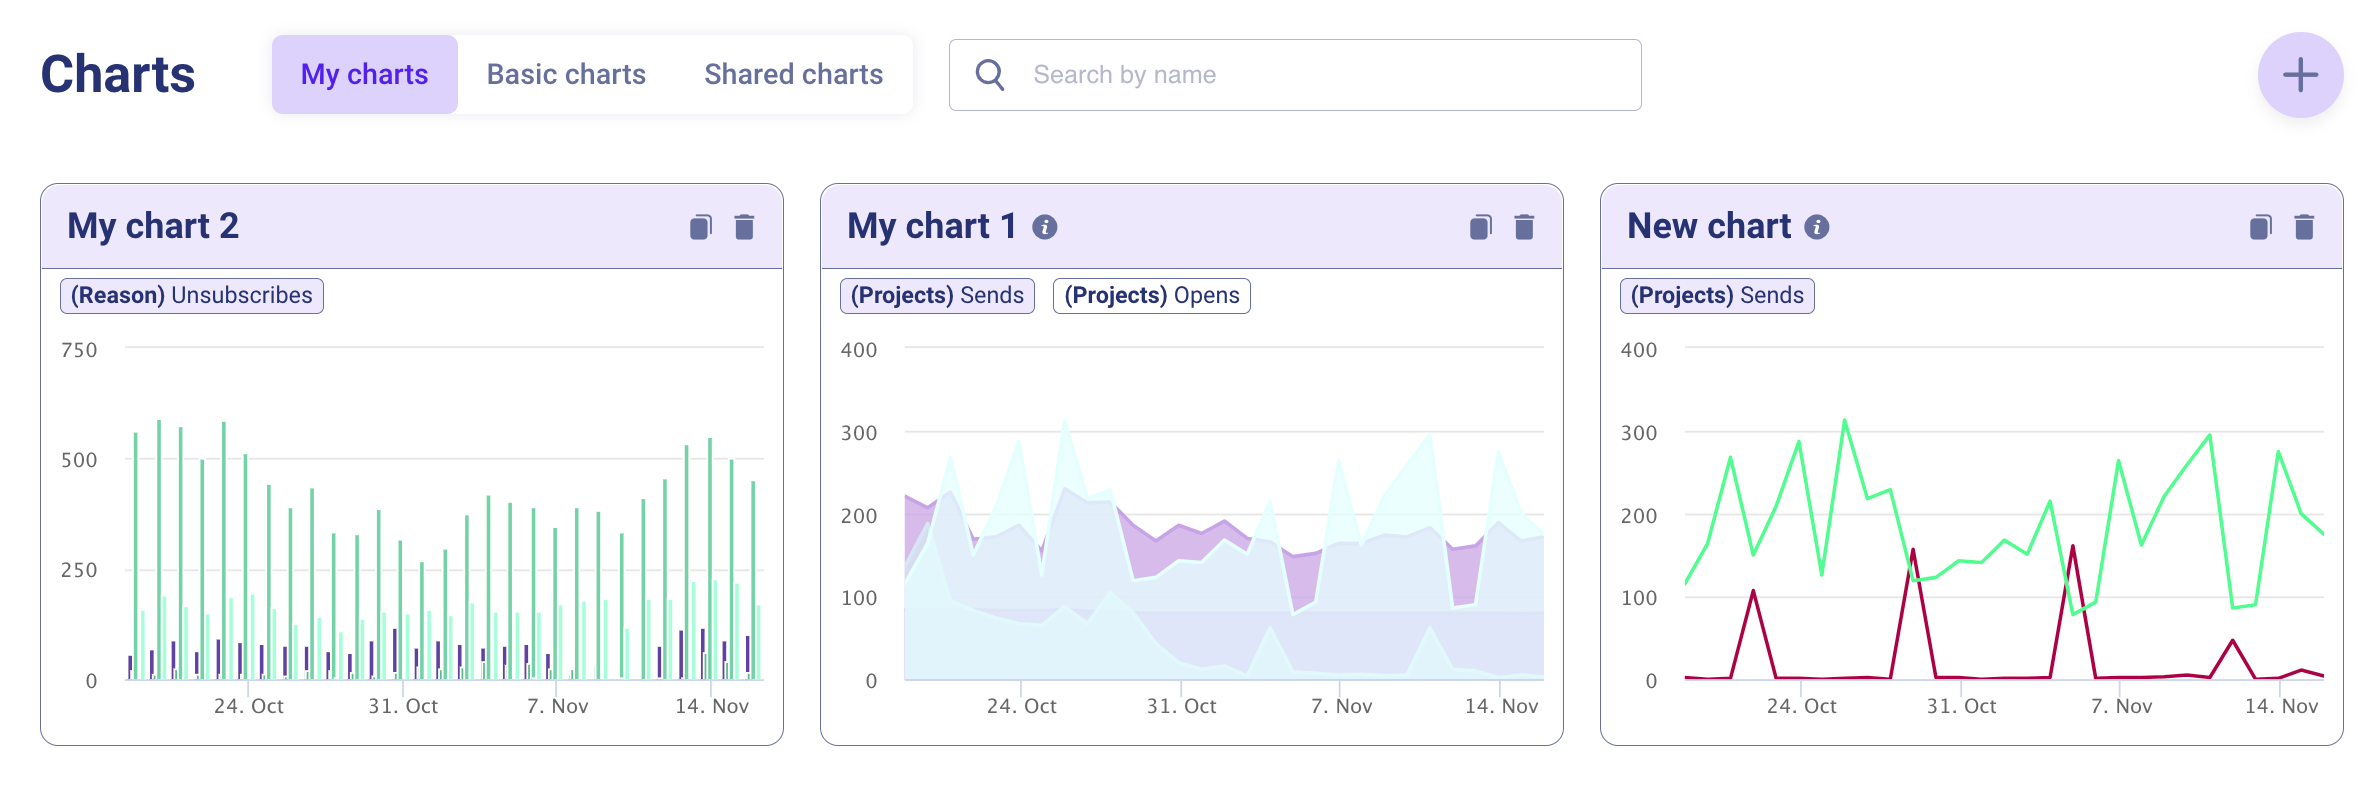
Here, you can:
- Open My charts, Basic charts, Shared charts lists using the corresponding tabs;
- Search for a chart by its name;
- Make changes to the existing charts.
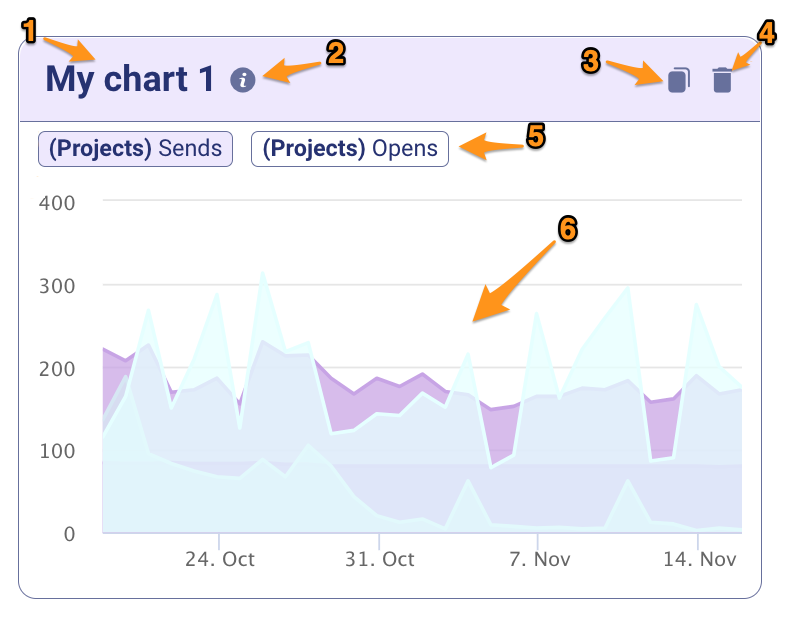
Let's take a closer look at the chart preview:
-
Name of the chart – to open a chart for editing or viewing, simply click on its name. You will be directed to a page where you can modify all the fields you added while creating the chart.
-
Description of the chart – click on this icon to see more information about the chart:
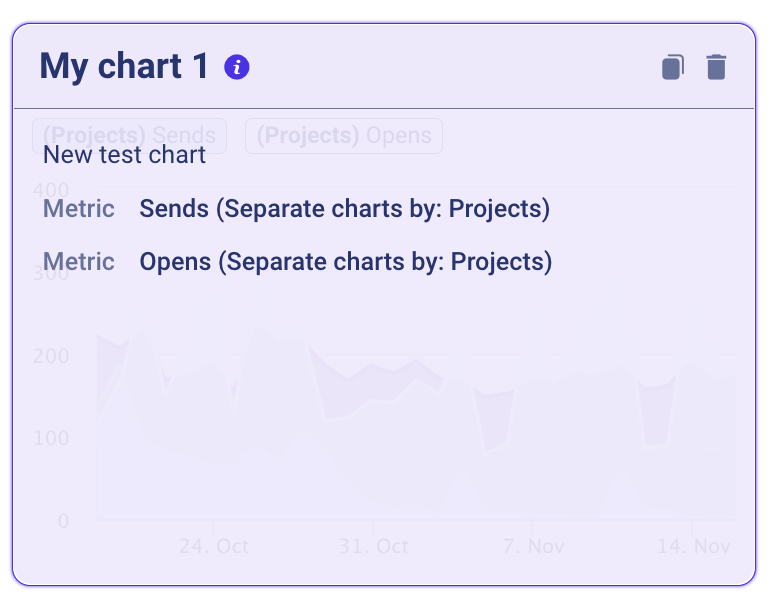
The icon is available only if the Description field was filled in when creating the chart.
- Copying the chart – create a copy of your chart with the name "chart name + copy". The copied chart will immediately be displayed in your chart list.
- Deleting the chart – be careful with this option, as it deletes your chart forever.
Please note that the charts used in your dashboard cannot be deleted.
- Chart metrics – clicking on a specific metric displays the corresponding graph in the chart preview.
- Graphic preview – provides a visual representation of the chart, allowing you to quickly assess it before making any further edits or viewing it in detail.
Updated over 2 years ago
Did this page help you?