How to create a dashboard?
Dashboard is an information board for a brief overview of optionally placed charts.
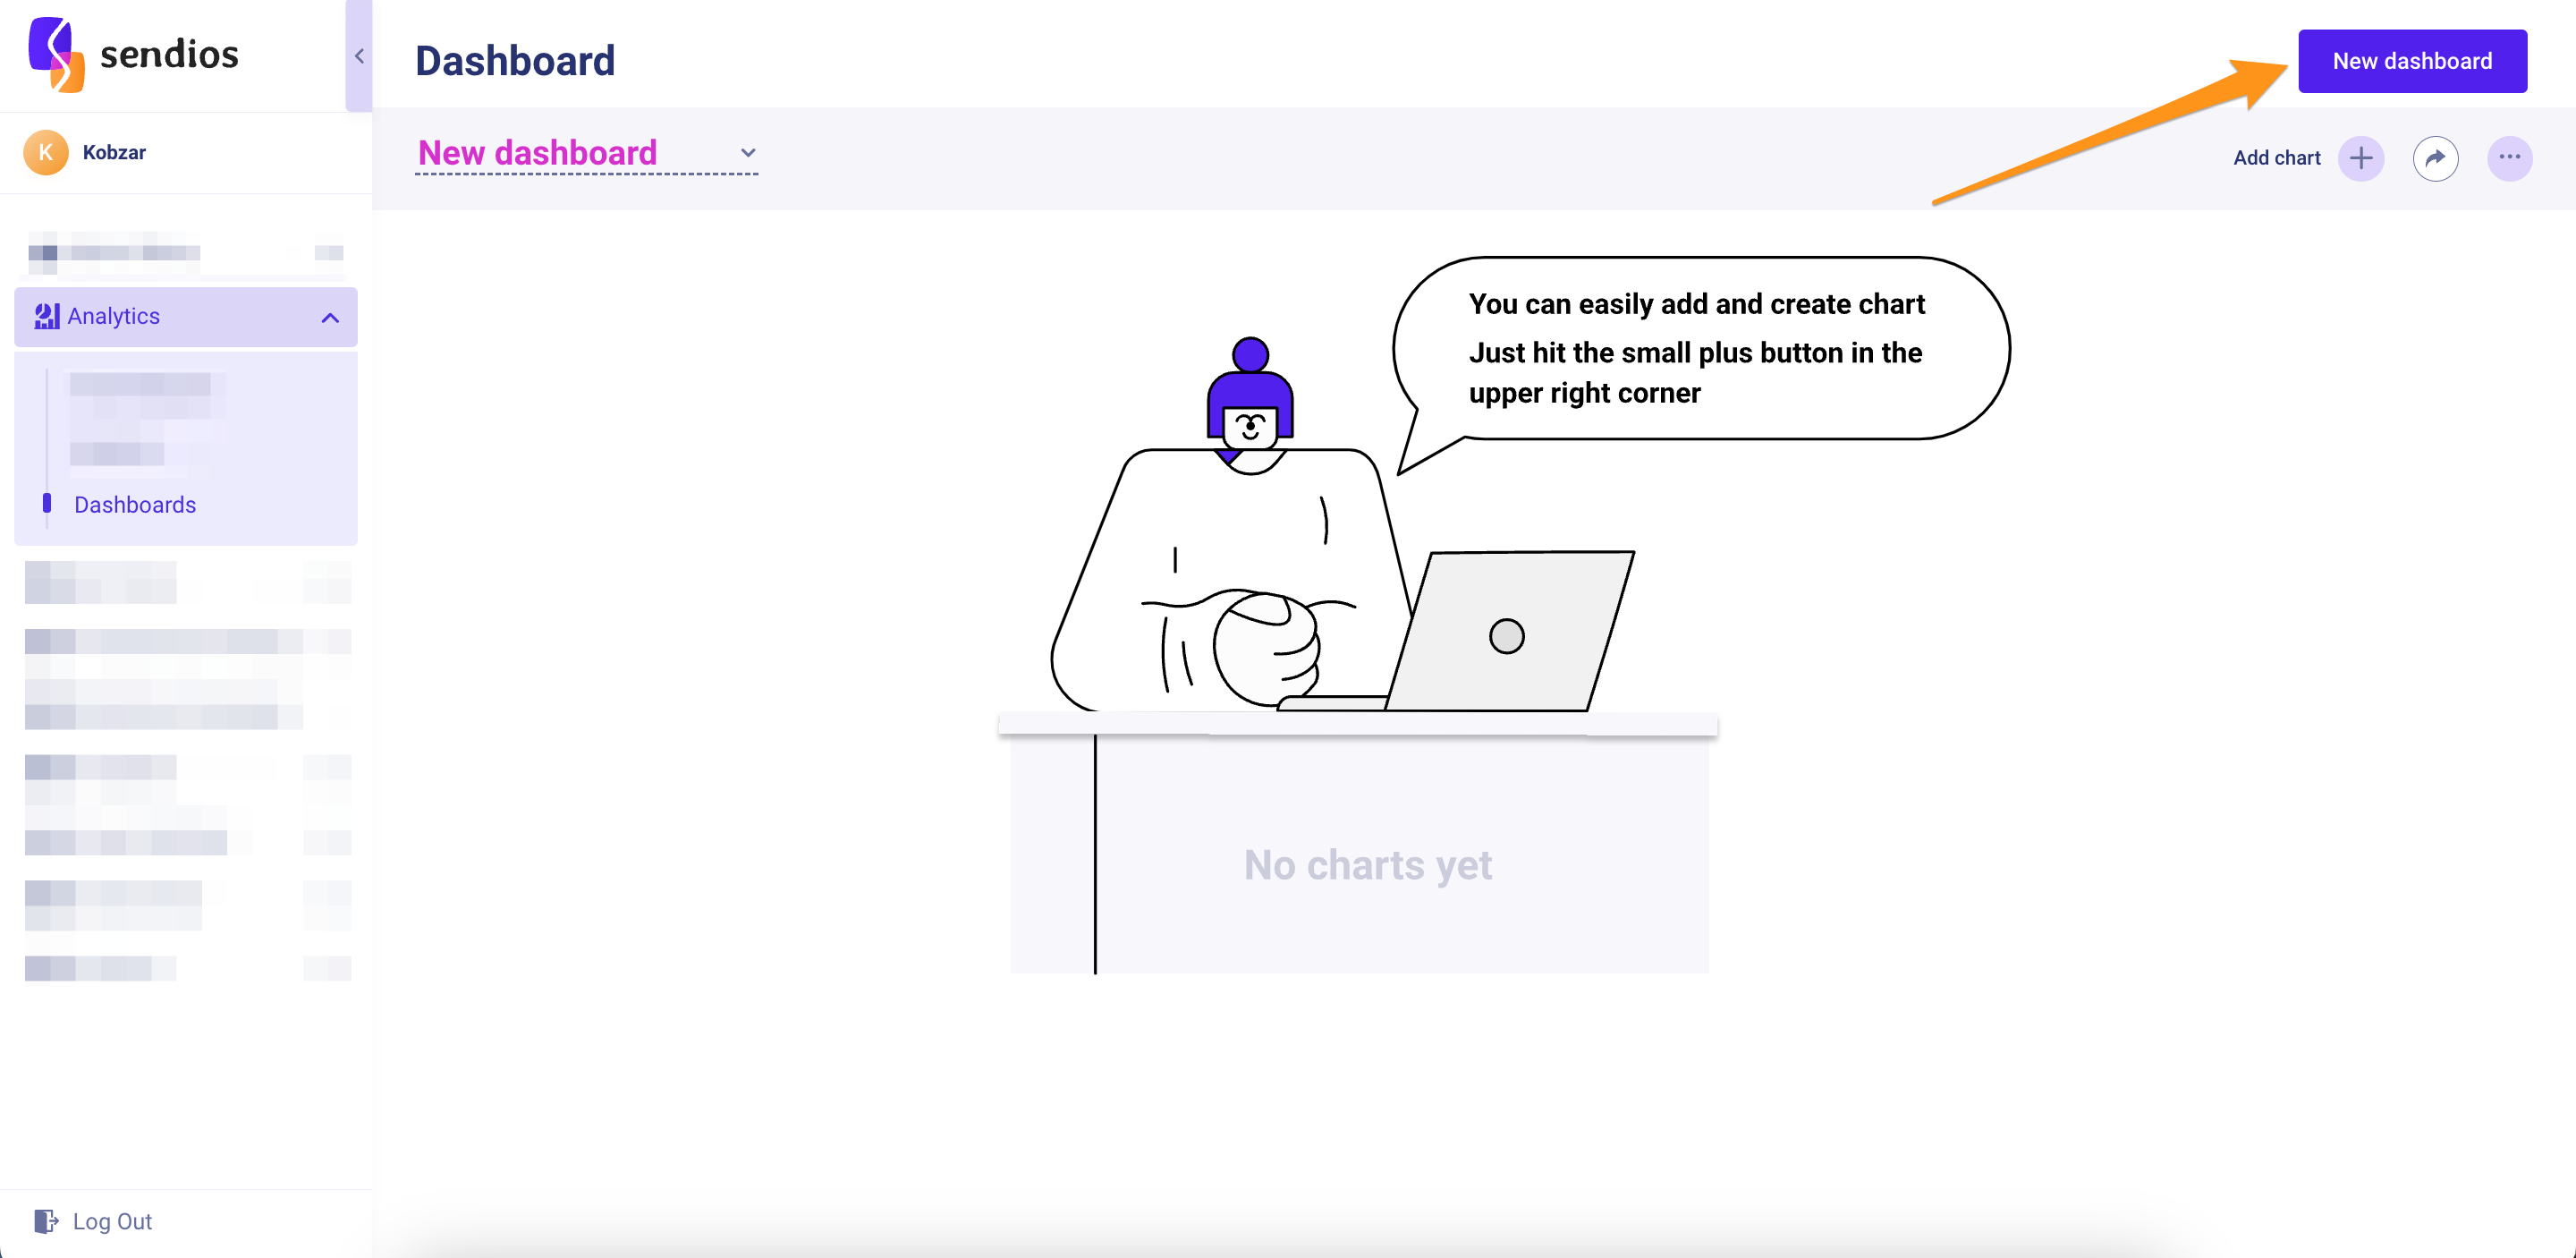
Creating a new dashboard
- Go to the Analytics → Dashboard page and click on New dashboard.
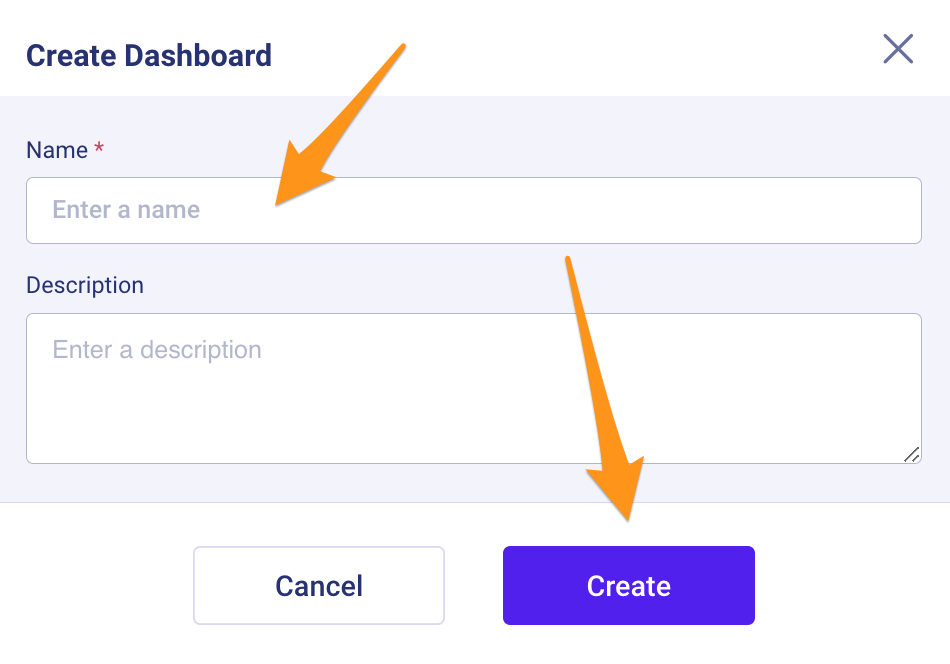
- In the open modal window, type the dashboard's name in the Name field. Then, if you wish, add a description for your dashboard in the Description text field and click the Create button.
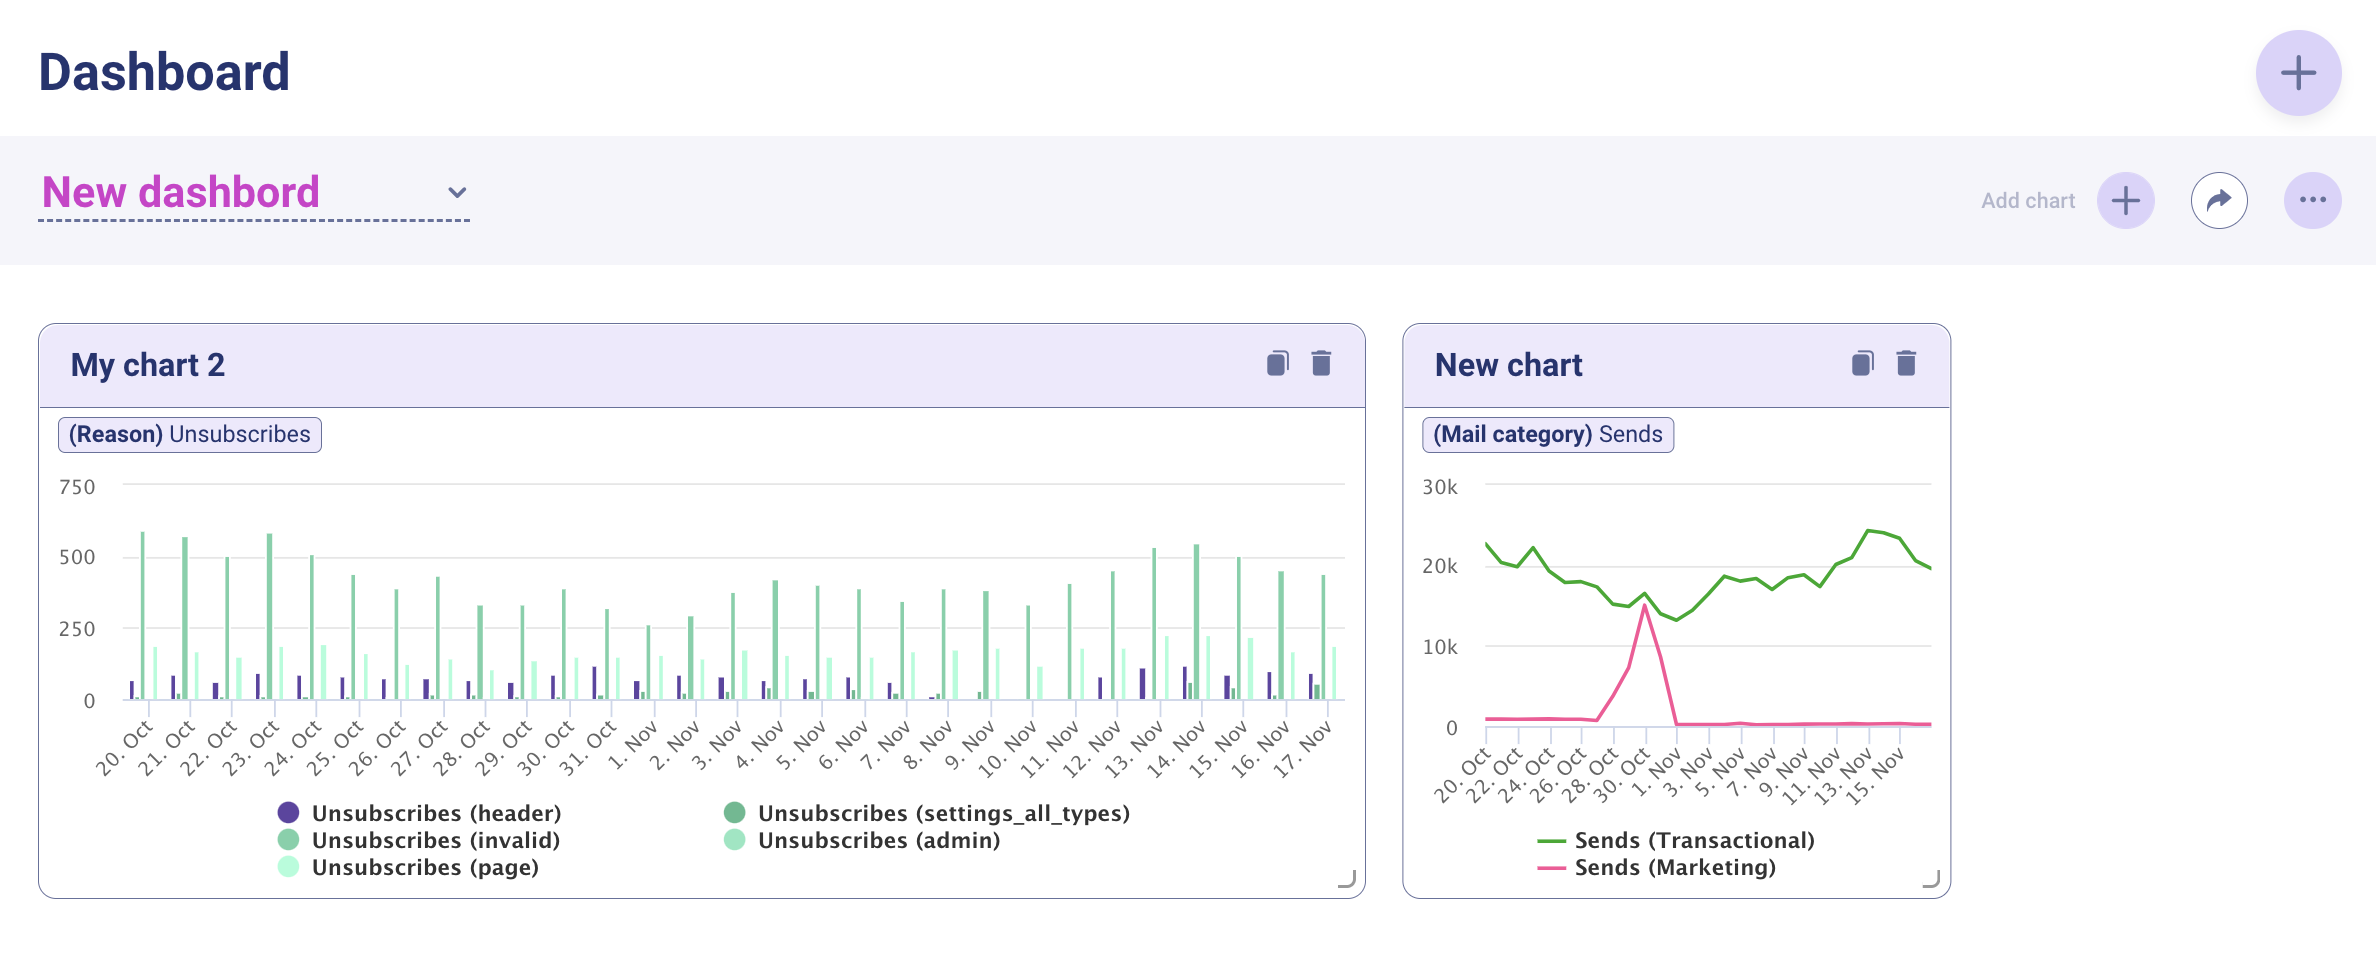
- On the dashboard page, add the charts you need.
Additional options
Let's take a closer look at the dashboard menu bar:
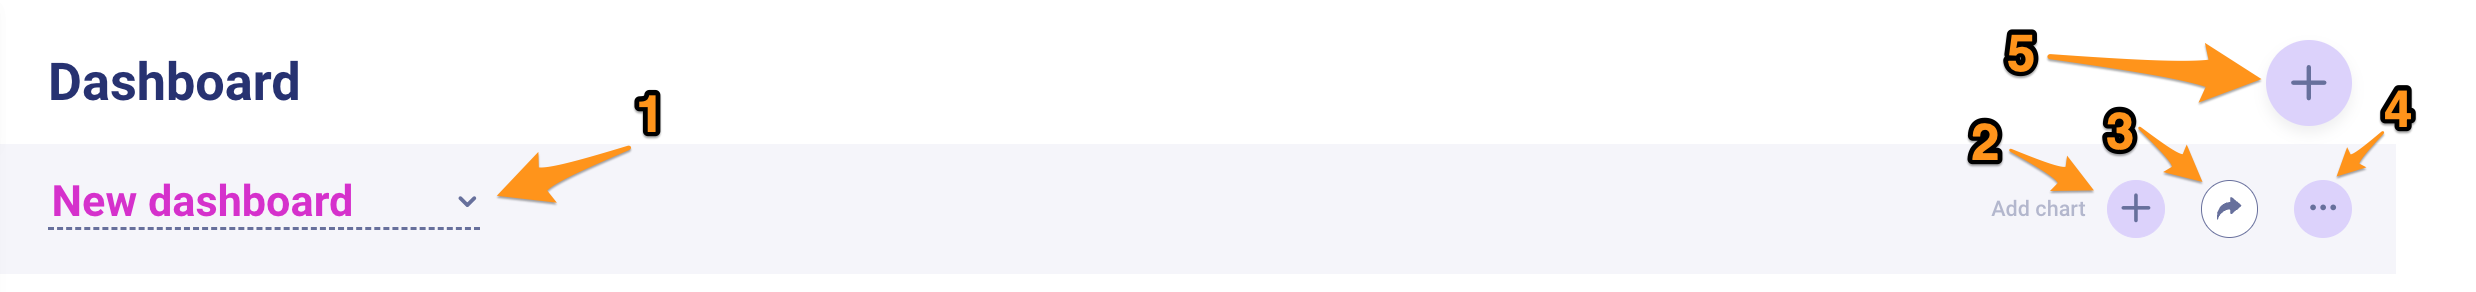
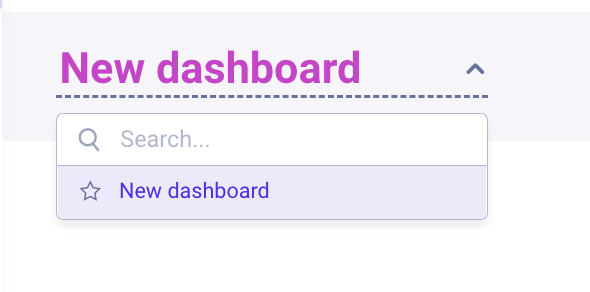
- Dashboard Name – here, you can add the desired dashboard to the favorites by choosing it from the list of dashboards and clicking the star next to it. This favorite dashboard of yours will be chosen as the default one.
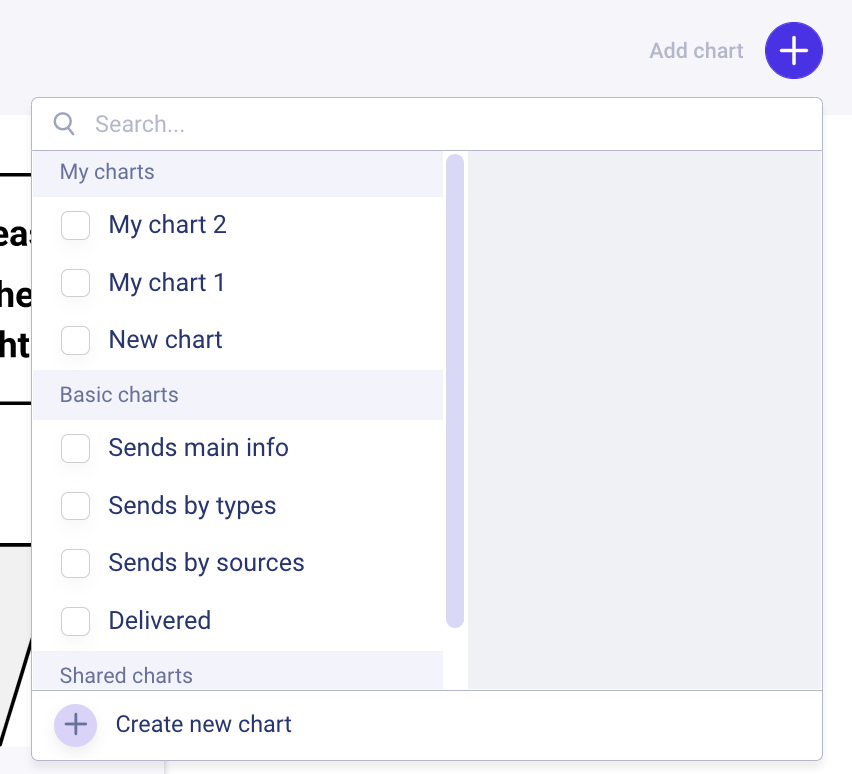
- Add the chart to the dashboard – click here to see the full list of the available charts. Also, you can create a new chart by clicking the Create new chart button.
- Share dashboard – this function will make the dashboard available to your teammates. To share your dashboard, just click the Share settings button and enable the Shareable option.
Please note that you can share those dashboards which consist of the shared charts only.
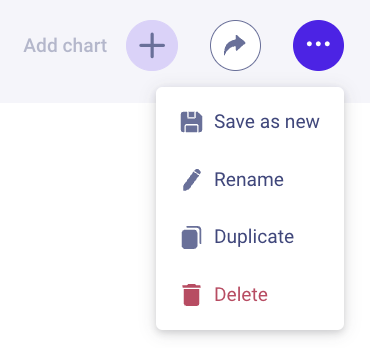
- Actions with dashboard – clicking the three dots allows you to:
-
Save as new – a window will open for entering the name of a new dashboard that will be created;
-
Rename – change the name and description of the dashboard;
-
Duplicate – a new dashboard will be created with the name "dashboard name +
copy"; -
Delete – the dashboard will be deleted forever.
- Add new dashboard
After adding the charts to your dashboard, you can arrange them in the desired order, resize them to your liking, and make other changes not leaving this page.
Updated over 2 years ago
Did this page help you?